May 2026
Reading Between the Square Feet
We see “square feet” everywhere in a project – in lease agreements, programming calculators, test fits – yet the numbers are not always the same. Rentable, usable, and carpetable square feet each represent a different way of how we see space, shaping how landlords price it, how designers plan it, and how clients ultimately experience it.
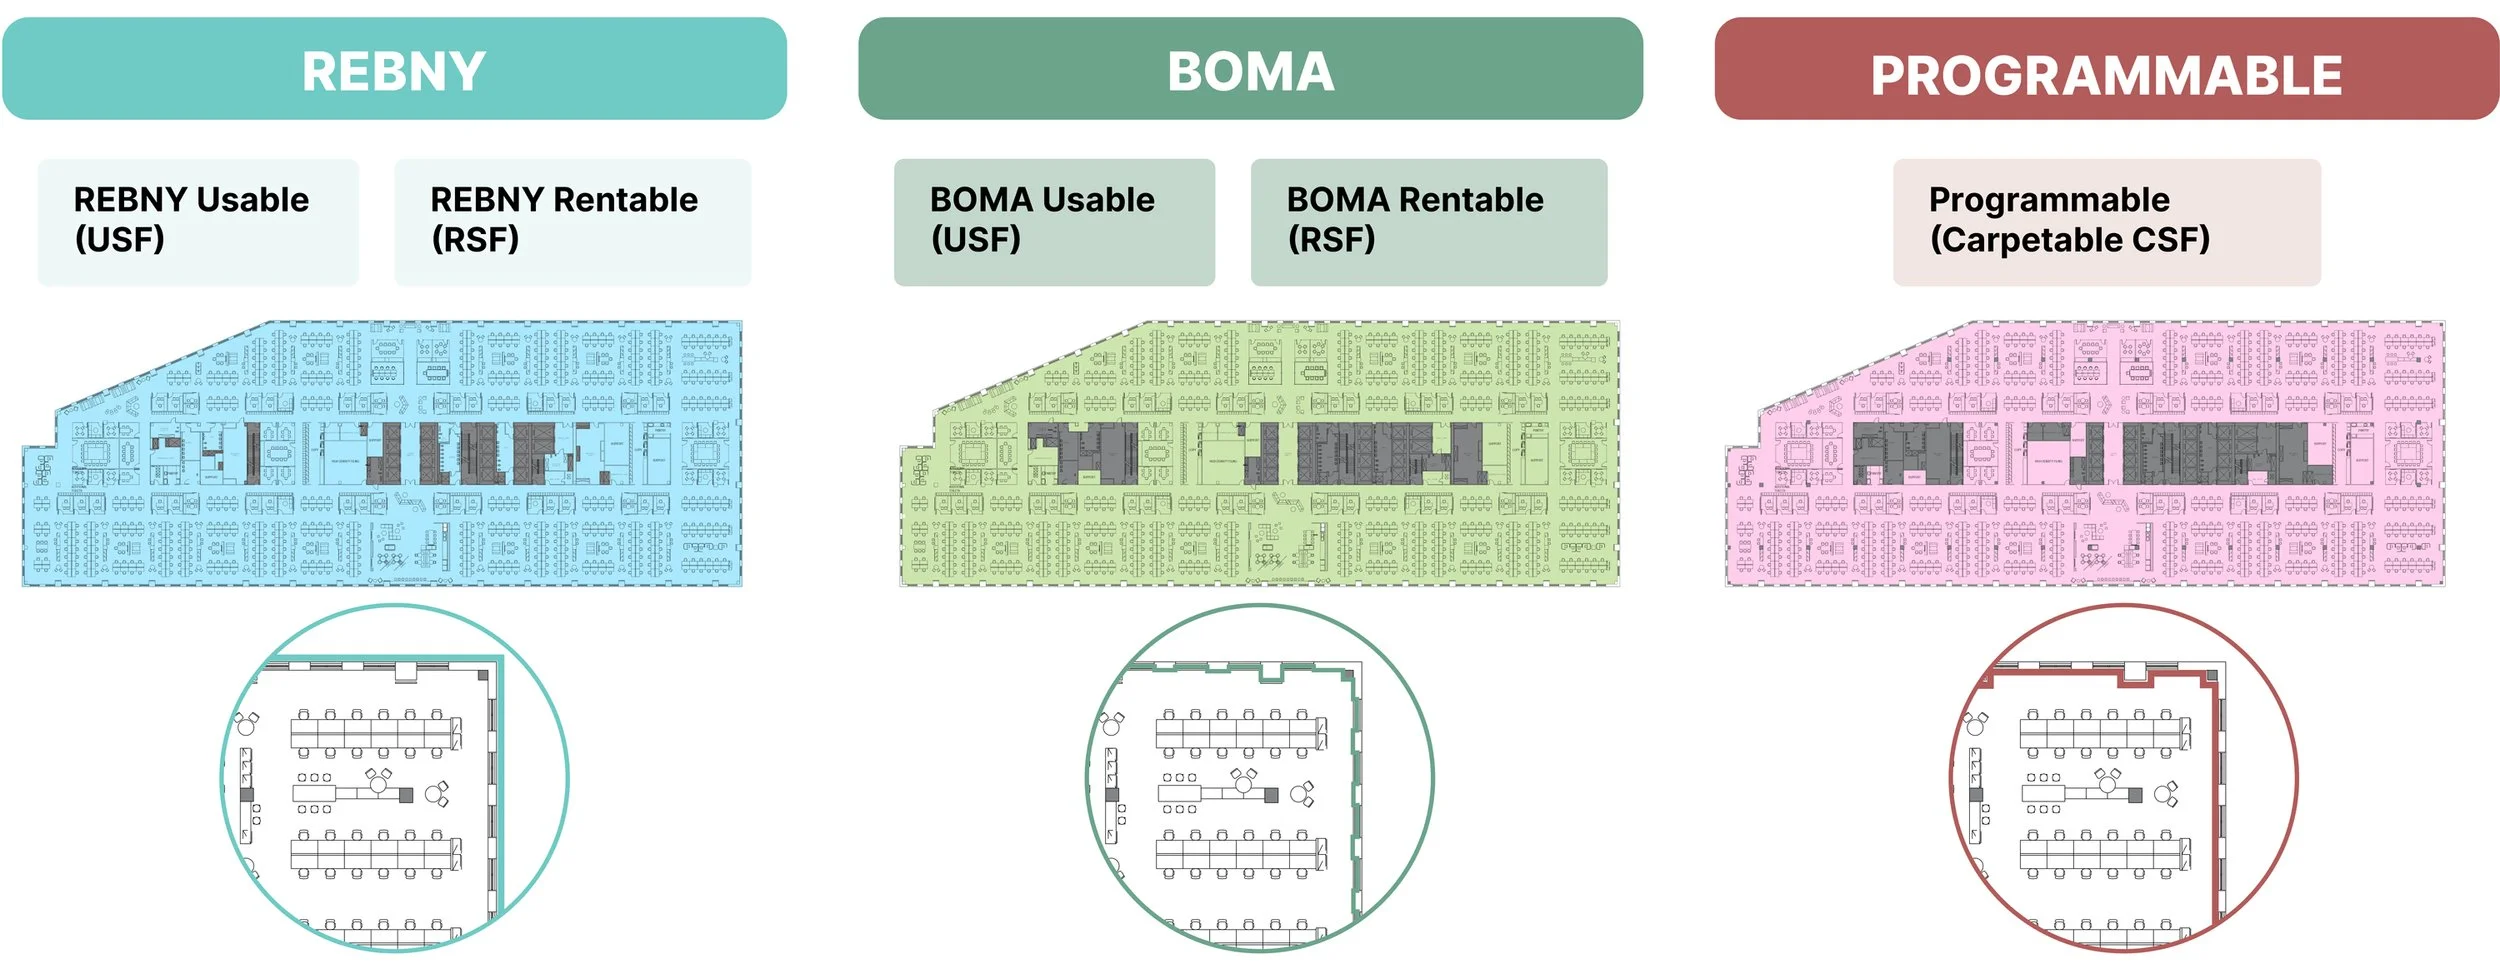
Three of the most common ways we measure and classify space are through REBNY standards, BOMA standards, and our internal programming standards. (We’ve also worked with client-specific frameworks such as Google and are able to adapt to their needs.)
Our rule of thumb is: if you can draw a line in any Autodesk platform, you’ve already got the foundation for it!
At their core, these standards all work the same way – the differences come down to the nuances of where those boundary lines are defined. That could mean measuring to the exterior façade vs the interior face, using the midpoint of an interior partition vs its face, or excluding certain space types from the entire measurement altogether. The trick is understanding which rules apply to each standard.
Overview of BOMA and REBNY
If we had a nickel for every time someone asked us about BOMA or REBNY, we’d have a lot of nickels – instead, we just have a strong grasp on how much confusion exists around square footage. As designers and architects, we are often inundated with terms like USF, GSF, CSF, RSF, GIA, NIA, etc, and it can feel a bit daunting, but it’s really about how we slice the cake to get to something that helps us benchmark the space.
Did you know the BOMA Office Standards have existed since 1915? BOMA proposes a nationally recognized and standardized measurement framework across the United States and Canada. REBNY, on the other hand, is primarily used in New York City (as its name suggests) and reflects the local market through loss and load factors that fluctuate depending on real estate conditions. Together, these standards establish a shared language for landlords, tenants, brokers, architects and designers for how we approach measuring and evaluating space.
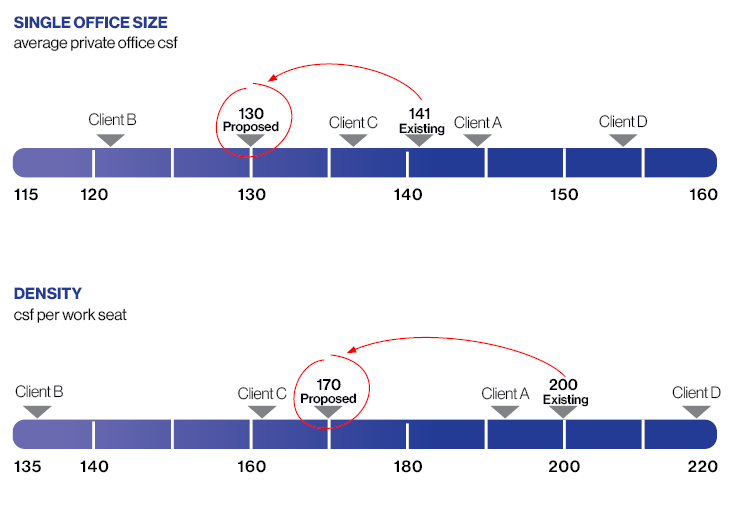
Programming the Workplace
Ark has measured and collected over 500 projects in our database using our own programmable standard, which we’ve leveraged across project presentations, pitches, and workplace trend reports. This data stems from benchmark reports that are based on HLW-designed projects. We often use this data to compare key planning metrics across peer organizations, helping clients understand where they fit and how those benchmarks may evolve in their future space (shown right). Together, these insights give us a data-driven edge to how we plan and design the future workplace.